
FNIRSI · DPOX180H
FNIRSI DPOX180H Review Part 1: Features and Technical Overview
A detailed look at the FNIRSI DPOX180H oscilloscope, its DDS signal generator, specifications, connections, terminology and intended low-voltage use cases.
A multimeter can tell us how many volts are present. When the question becomes how that voltage changes over time, whether a narrow pulse occurred, or how two signals line up, we need an oscilloscope.
The FNIRSI DPOX180H combines a portable two-channel oscilloscope and a DDS signal generator. I physically own this unit, but Part 1 is deliberately not a hands-on verdict. This article establishes what the hardware claims to offer and what the specifications mean. My measurements of bandwidth, generator output, probes, accuracy, battery life and real circuits belong in Part 2.
What exactly is the FNIRSI DPOX180H?
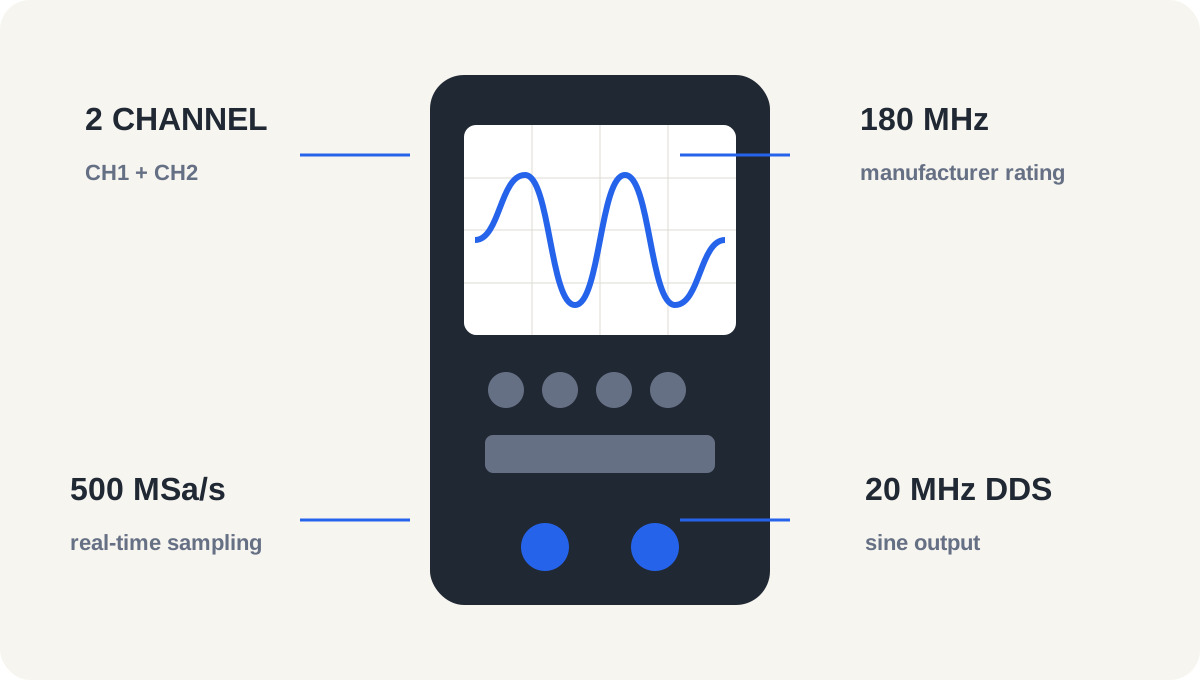
It is a handheld digital oscilloscope with two analog inputs, CH1 and CH2, plus a BNC output for its internal DDS generator. Two channels allow signals at two circuit nodes to be viewed against the same time and trigger reference.
“Digital phosphor” does not mean an analog CRT phosphor screen. Here it describes an intensity-style visualization built from repeated acquisitions. Frequently occurring traces can appear brighter or use a color-temperature scale, while less frequent events occupy different intensity levels. That can make signal distribution easier to see, but I am not treating the instrument’s actual persistence performance as proven before testing it.
Core specifications
These are manufacturer specifications from FNIRSI’s current product page and the DPOX180H manual, not independent laboratory results.
| Item | Manufacturer specification |
|---|---|
| Inputs | 2 analog channels with a common ground reference |
| Analog bandwidth | 180 MHz |
| Real-time sample rate | Up to 500 MSa/s |
| Memory depth | 120 Kpts |
| Display | 2.8-inch IPS, 320 × 240 pixels |
| Input coupling | AC / DC |
| Input impedance | 1 MΩ / 18 pF |
| Vertical scale | 5 mV/div to 10 V/div at 1X setting |
| Time base | 5 ns/div to 50 s/div |
| Trigger | Digital; Auto, Normal, Single; rising/falling edge |
| Display modes | YT, X-Y and Roll; Zoom and FFT listed |
| Storage | 250 waveforms, 90 screenshots, USB export |
| DDS generator | 14 standard waveforms; sine up to 20 MHz, others up to 10 MHz |
| Generator adjustment | 1 Hz frequency step; duty adjustment for square wave |
| Battery / charging | 3000 mAh; 5 V / 2 A charging |
| Dimensions | 135 × 90 × 40 mm |
FNIRSI’s product page states up to 50,000 wfm/s. Some online manual summaries list 30,000 wfm/s, so I will not resolve that conflict by guessing. The page also mentions 1 Vpp for the generator without clearly defining all load and frequency conditions; that needs measurement rather than repetition as a guaranteed output.
What does 180 MHz bandwidth mean?
Oscilloscope bandwidth describes the frequency response of the analog input path. The quoted boundary is commonly where a sine-wave amplitude has fallen by roughly 3 dB from its low-frequency value. It does not mean every 180 MHz signal will be reproduced perfectly.
A square wave contains a fundamental plus higher harmonics that create its edges. Preserving the shape of a 20 MHz square wave therefore demands more bandwidth than merely displaying a 20 MHz sine wave. The familiar approximation tr ≈ 0.35 / BW relates bandwidth and rise time, but probe loading, sampling and the source itself also contribute.
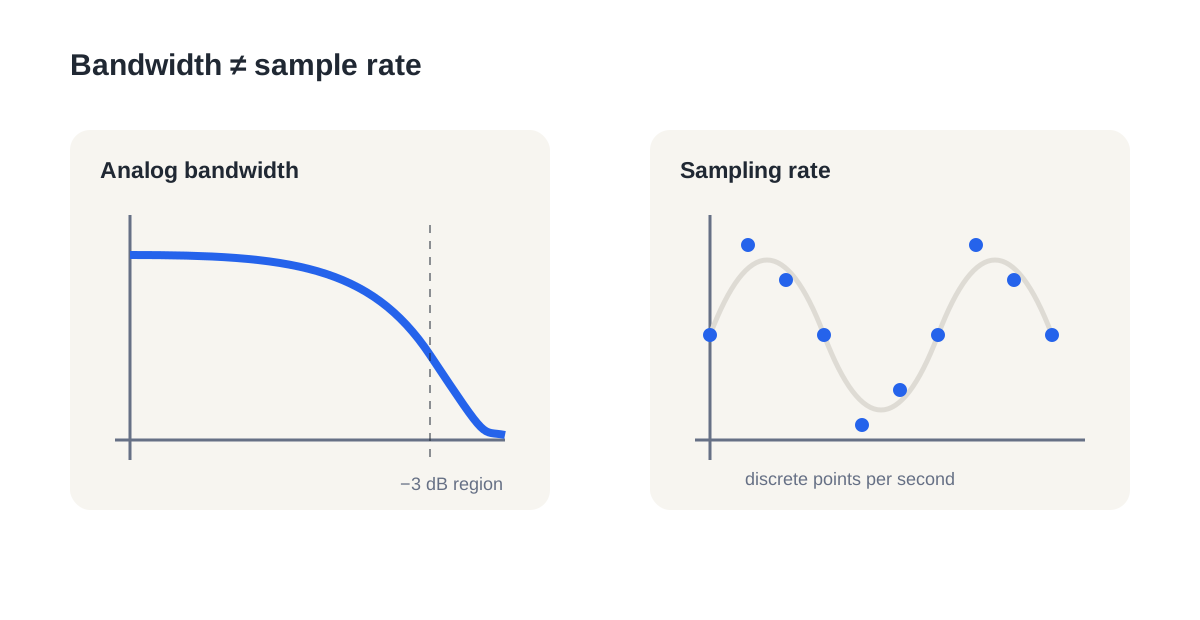
Part 2 will examine FNIRSI’s 180 MHz claim through amplitude response and rise-time measurements instead of presenting the label as a verified result.
What does 500 MSa/s mean?
Sa/s means samples per second. A maximum of 500 MSa/s theoretically represents 500 million digitized points per second. Bandwidth defines what reaches the converter; sample rate defines how densely that signal is represented in time.
Nyquist gives a theoretical minimum above twice the highest frequency component, but two points per cycle rarely provide useful waveform fidelity. Practical work benefits from more points per cycle, adequate memory, stable triggering and suitable interpolation. I will also check how acquisition behaves with both channels enabled.
Why two channels matter
CH1 and CH2 can compare:
- Circuit input and output,
- PWM command and sensor response,
- Encoder A and B phases,
- STEP and DIR lines,
- A MOSFET gate and a low-voltage output node,
- Ripple at two low-voltage supply points.
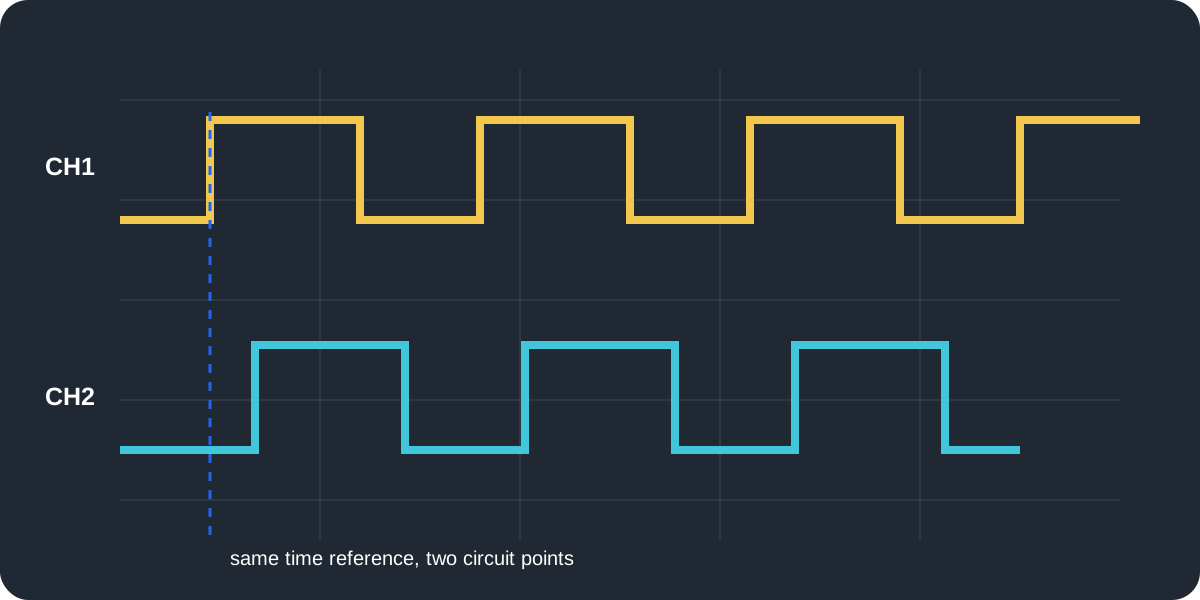
The manual states that the two probe grounds are common internally. Ground clips must not be attached to nodes at different potentials.
Display and physical layout
The front panel contains the 2.8-inch 320 × 240 IPS display, dedicated function keys and directional controls. CH1, CH2 and generator BNCs sit on the top edge; USB handles charging/data, and a folding stand is built into the rear. At 135 × 90 × 40 mm, it clearly occupies a different physical class from a bench scope.
This is an objective layout description. Button feel, readability, balance and portability will be assessed only after real use in Part 2.
Built-in DDS signal generator
DDS, or Direct Digital Synthesis, creates periodic signals from a digital phase accumulator and waveform data. The manual lists 14 standard function waveforms plus a custom clipping/chopping waveform derived from an acquired trace. It explicitly states up to 20 MHz for sine and 10 MHz for other waveforms, a 1 Hz frequency step, and duty-cycle control for square waves. The published text does not enumerate all 14 names, so I will not invent a complete list beyond confirmed examples such as sine, square and triangle.
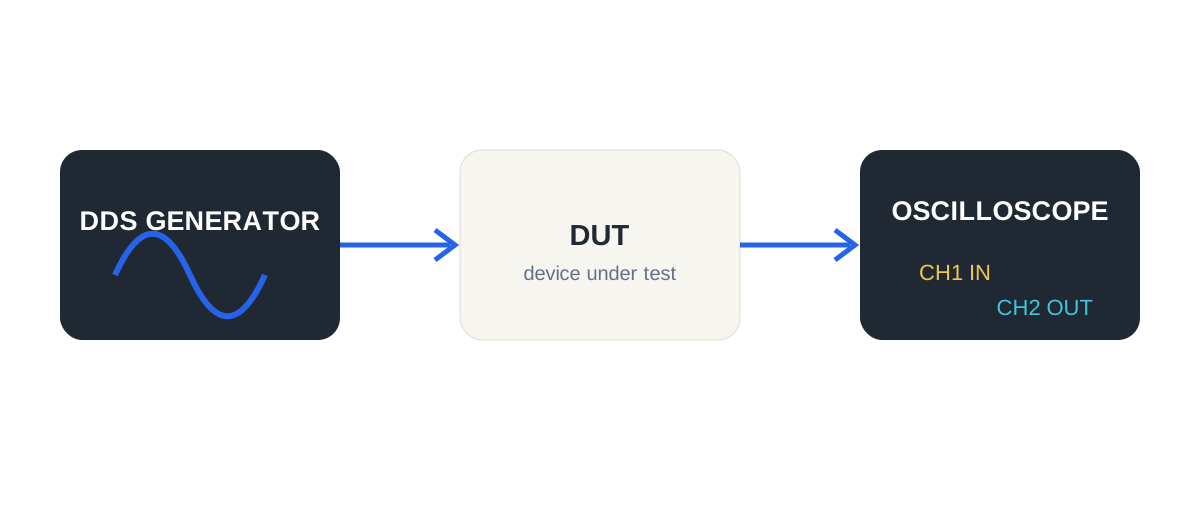
A useful arrangement is Generator OUT → DUT → CH1/CH2: CH1 monitors the stimulus and CH2 the response. That can support low-voltage filter, amplifier or control-circuit experiments. Output amplitude, impedance and distortion still require measurement.
Where could it help in automation and maintenance?
Within safe low-voltage limits, possible jobs include:
- Observing 24 VDC sensor switching,
- Comparing encoder A/B phases,
- Inspecting PWM and STEP/DIR pulses,
- Looking for noise on a 0–10 V signal,
- Checking the low-voltage control side of a relay or solenoid driver,
- Viewing microcontroller clocks, PWM and communication waveforms.
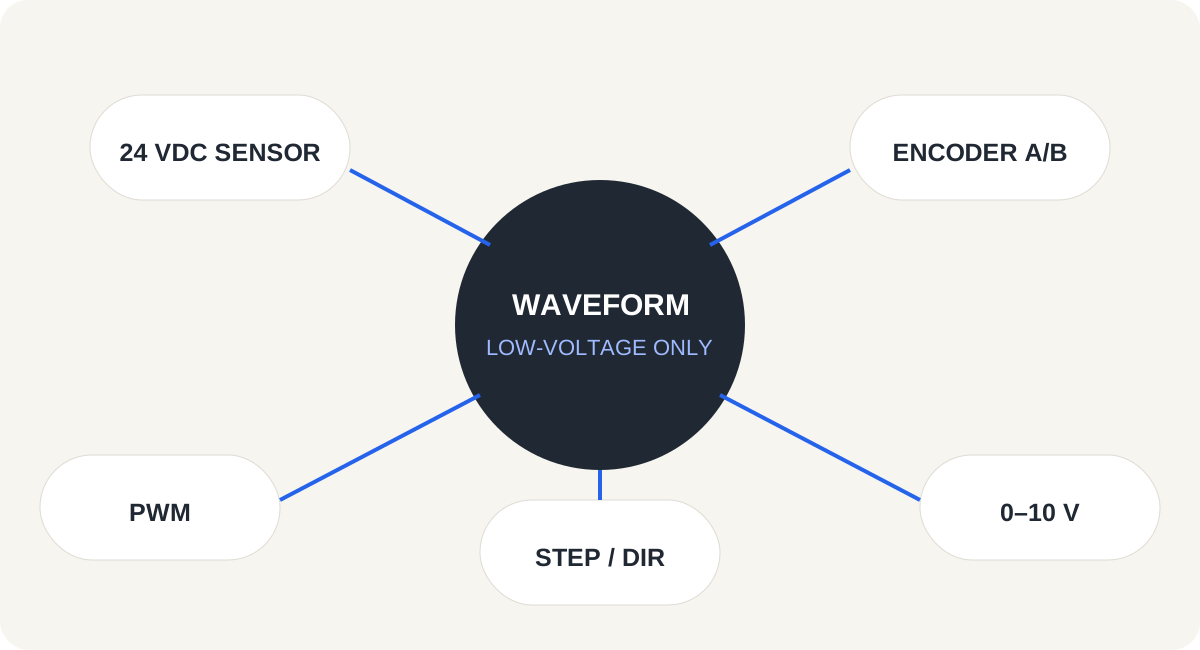
These examples are not permission to connect directly to 230/400 VAC power circuits. A “400 V protection” claim alone is not a complete mains safety rating.
Electronics use cases
The instrument can display the analog shape of Arduino PWM, ESP32 GPIO, UART, I²C and SPI lines, switching-regulator ripple, oscillators, audio and sensor signals. Displaying a waveform is not the same as protocol decoding: FNIRSI’s documentation does not list UART/I²C/SPI decoding, so I do not claim it.
Multimeter or oscilloscope?
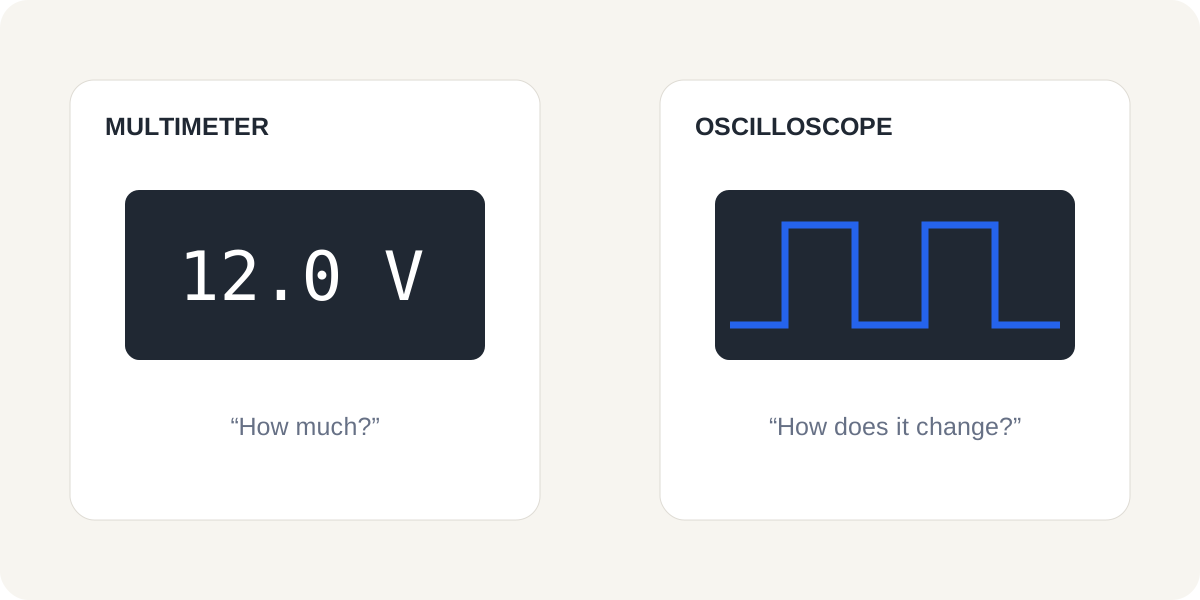
A multimeter usually answers how much; an oscilloscope answers how it changes with time. On a pulsed 24 VDC sensor line, a meter may show an intermediate reading influenced by duty cycle, while a scope can reveal high/low levels, period and edges. The exact meter response depends on its measurement method and bandwidth.
Quick technical glossary
| Term | Meaning |
|---|---|
| Bandwidth | Frequency response of the analog input path |
| Sample rate | Number of digitized samples per second |
| Channel | Independent signal input; CH1 or CH2 here |
| Time base | Time represented by each horizontal division |
| Vertical scale | Voltage represented by each vertical division |
| Trigger | Event or threshold that stabilizes acquisition |
| AC/DC coupling | Input choice that blocks or passes the DC component |
| Input impedance | Electrical load the scope presents to the circuit |
| Waveform | Voltage plotted against time |
| DDS | Digitally synthesized adjustable periodic signal |
Notable features on paper
- Two analog channels,
- Manufacturer claims of 180 MHz bandwidth and 500 MSa/s,
- 120 Kpts memory and intensity/color-temperature display,
- Battery-powered handheld format,
- Built-in DDS generator,
- X-Y, Roll, Zoom, FFT and storage functions.
This is not a pros list. These are the features that define the Part 2 test plan.
Who is it for?
On paper, the DPOX180H targets electronics learners, mechatronics and automation students, makers, embedded developers, and technicians who want a portable scope for low-voltage diagnostics. It should not automatically be treated as a replacement for a bench oscilloscope with a larger display, deeper analysis, calibrated performance, advanced triggering and documented safety certification.
Important measurement safety note
Battery power and a handheld case do not make every measurement safe. The manual explicitly says CH1 and CH2 share a common ground. Connecting their ground clips to different potentials can create a short circuit. Probe attenuation and scope settings must match, and high-frequency work requires a suitably rated 10X probe.
FNIRSI specifies up to 400 V input withstand/protection, but I cannot verify an explicit CAT II/III/IV measurement category in the documentation. It must not be interpreted as approval for direct work on mains or high-energy panels. Mains and floating/differential measurements require the correct CAT-rated differential probe or isolation strategy, protective equipment and competent procedure. A misplaced ground clip can cause equipment damage, arc energy and injury.
What is coming in Part 2?
The follow-up will cover:
- Real operation, menus and interface,
- Included probes and compensation,
- Real-circuit and safe 24 VDC measurements,
- PWM and dual-channel tests,
- DDS generator output,
- Bandwidth and rise-time experiments,
- Measurement accuracy,
- Battery life and ease of use,
- Genuine pros/cons and value assessment.
Part 1 was about understanding what the FNIRSI DPOX180H is and what its specifications mean. A final judgement should come after the measurements.